

Context map and diagrams
Once a model has grown past one board, it helps to see it from further away. Studio draws two kinds of read-only picture from your model: the context map of an application’s domains, and diagrams of an event model. You never edit them. They are always drawn from the model and follow it as it changes.
The context map
Section titled “The context map”A domain is a part of the business with its own language. The context map shows how the domains of one application relate: which domain publishes events and which takes them. In Acme Commerce, for example, the Catalog publishes price changes and Sales takes them in.
Open it
Section titled “Open it”In the project drawer, expand an application and select Context map.
If the application has no domains yet, the map says so. If an event model could not be read, the map says that too, rather than quietly leaving out what it should say, and offers Try again.
Read it
Section titled “Read it”The map uses the notation of context mapping.
- Every domain is a box marked «bounded context», listing the Published language it offers: the public events other domains can take.
- Systems outside the application are drawn with a dashed outline. Other applications that a contract is published to are shown under Other applications.
- Every relationship is a line between two domains. Its upstream end is marked U and its downstream end D, with the patterns each side takes: open host service (OHS) and published language (PL) upstream, anticorruption layer (ACL) and conformist (CF) downstream. The line is labeled with the events that cross it. Its tooltip reads in full, for example Sales takes these events from Catalog.
Select a domain to open its board. Select a relationship to open the slice that takes its events.
Diagrams of an event model
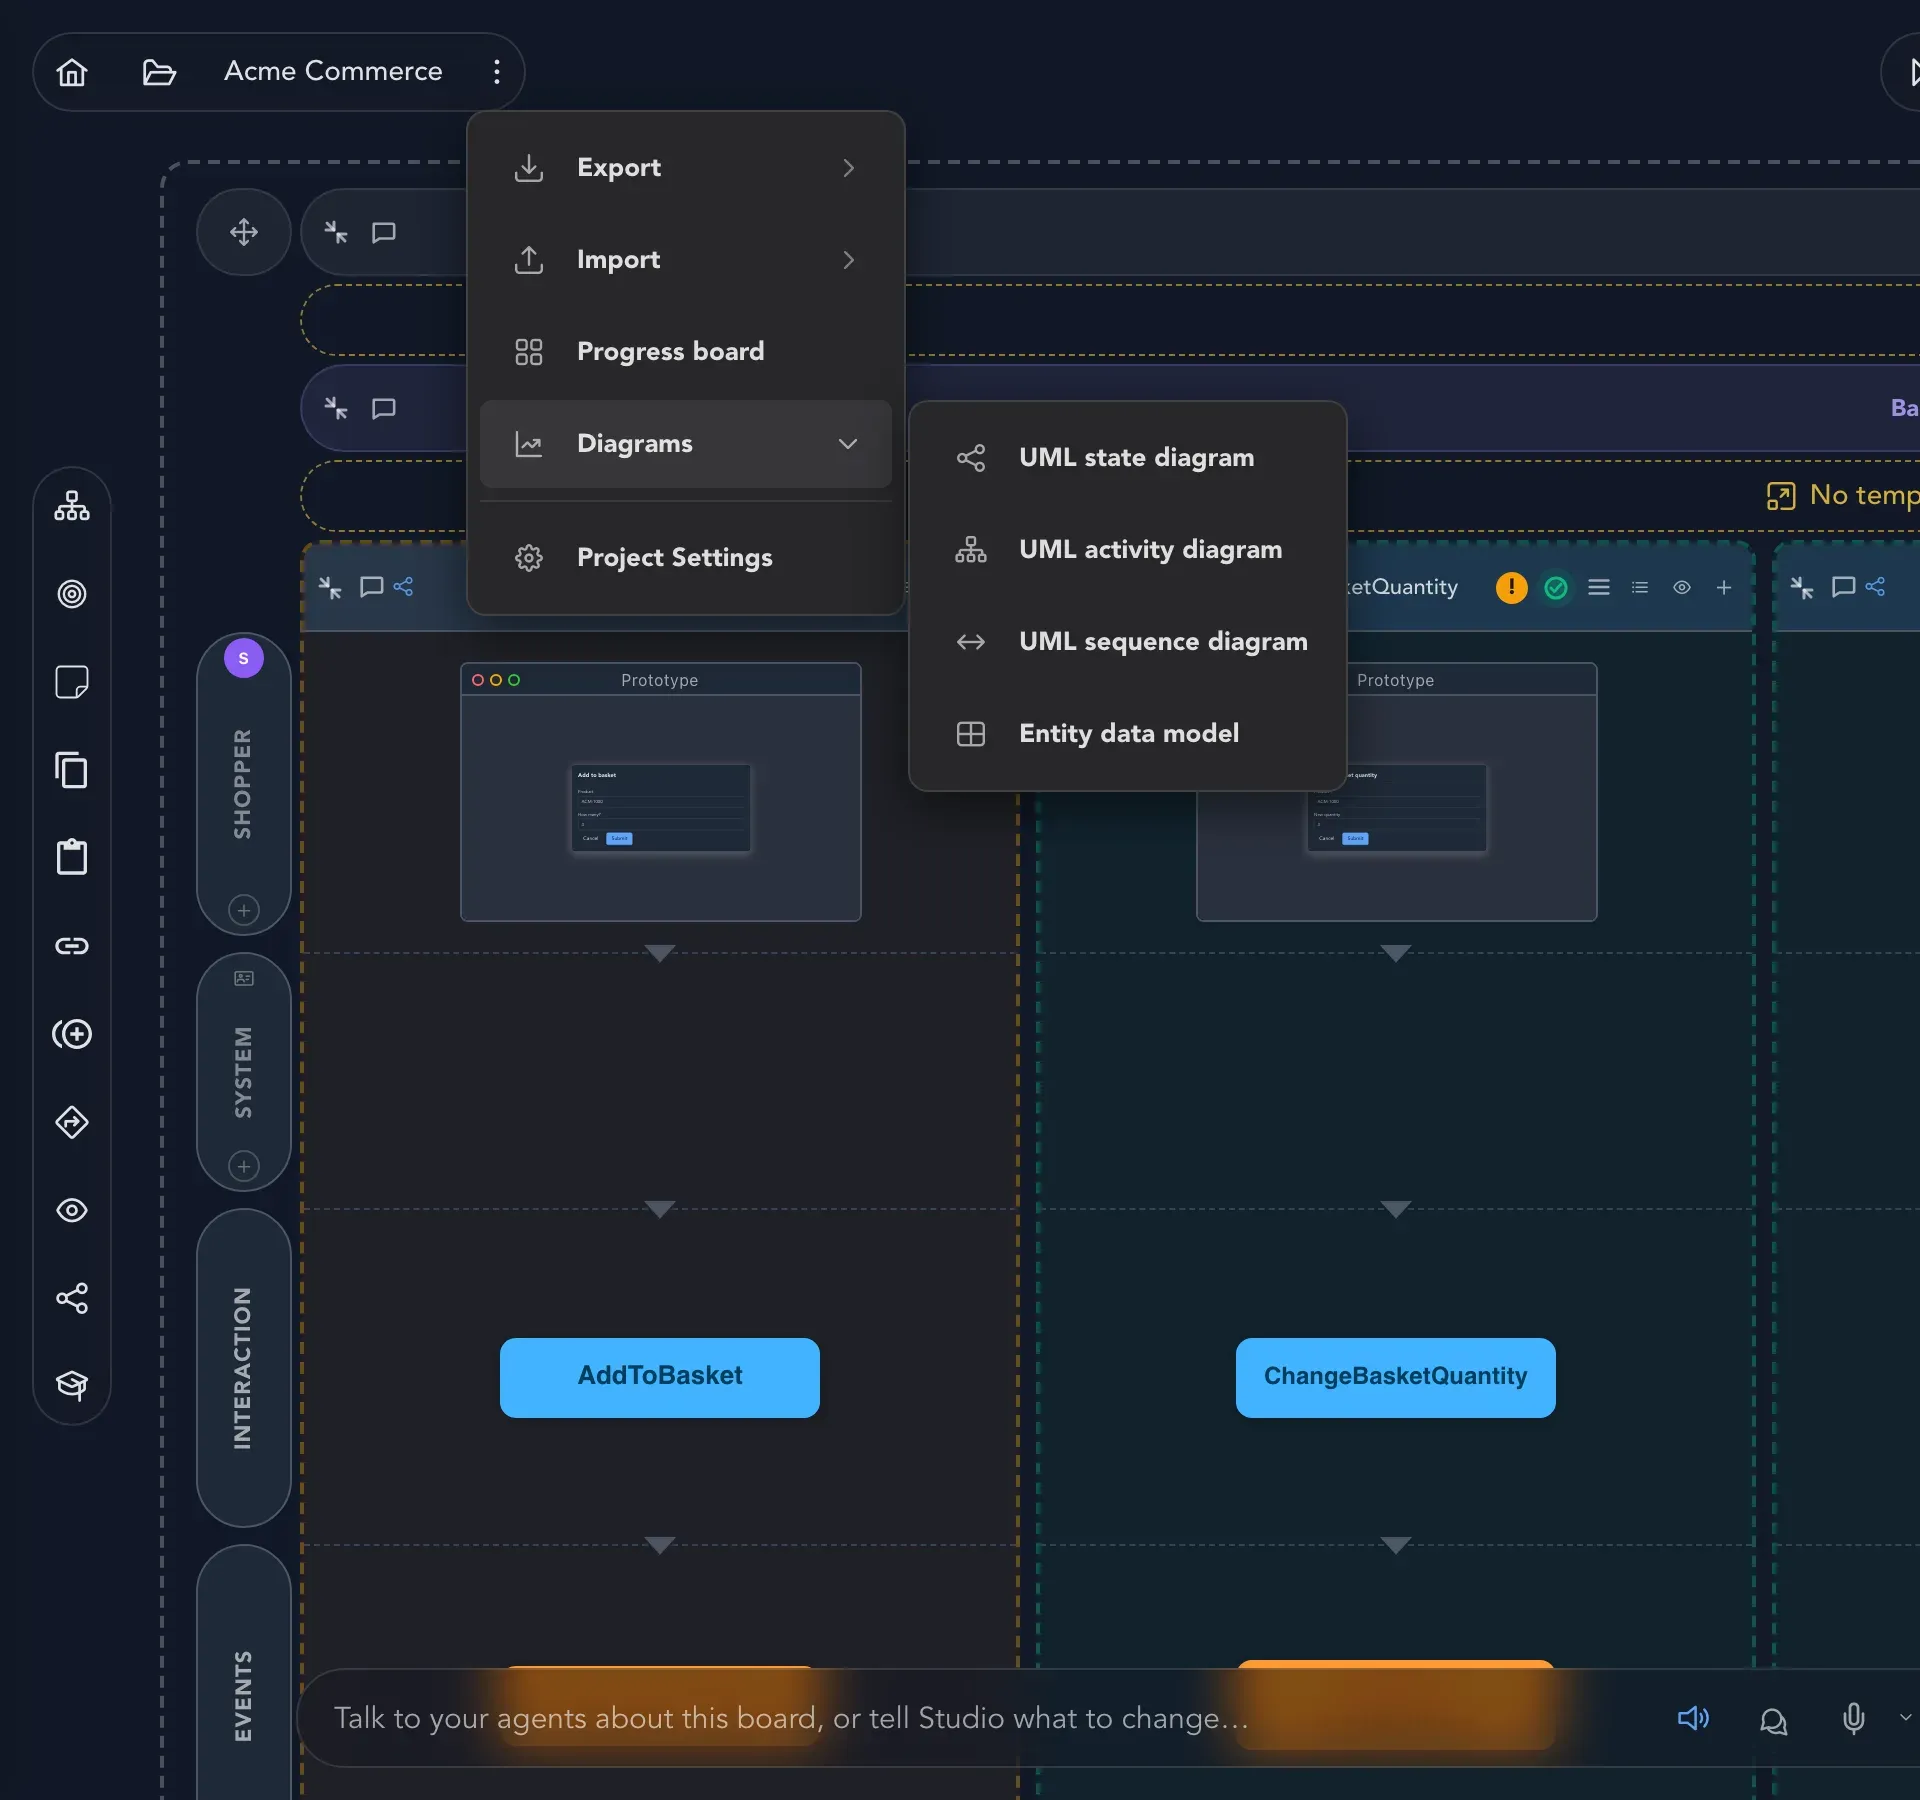
Section titled “Diagrams of an event model”Studio can draw an event model in four more ways. Open Project options, choose Diagrams and pick one:
| Diagram | What it shows |
|---|---|
| UML state diagram | The states that the event model’s events lead to. |
| UML activity diagram | The flow of the slices: decisions, forks and merges, where a command is rejected, and what the system does. |
| UML sequence diagram | One feature as messages between the user, screens, the command API, the event store, read models and external systems. |
| Entity data model | The read models as entities and how they relate. |
- Select Project options at the top left and choose Diagrams.
- Pick the diagram you want. It opens full screen.
- At the top of the diagram, choose which event model to draw if the project has more than one. In the picture below it reads Catalog / Catalog.
- For the state, activity and entity diagrams, narrow it with All modules, the second selector. For the sequence diagram, choose a Feature instead.
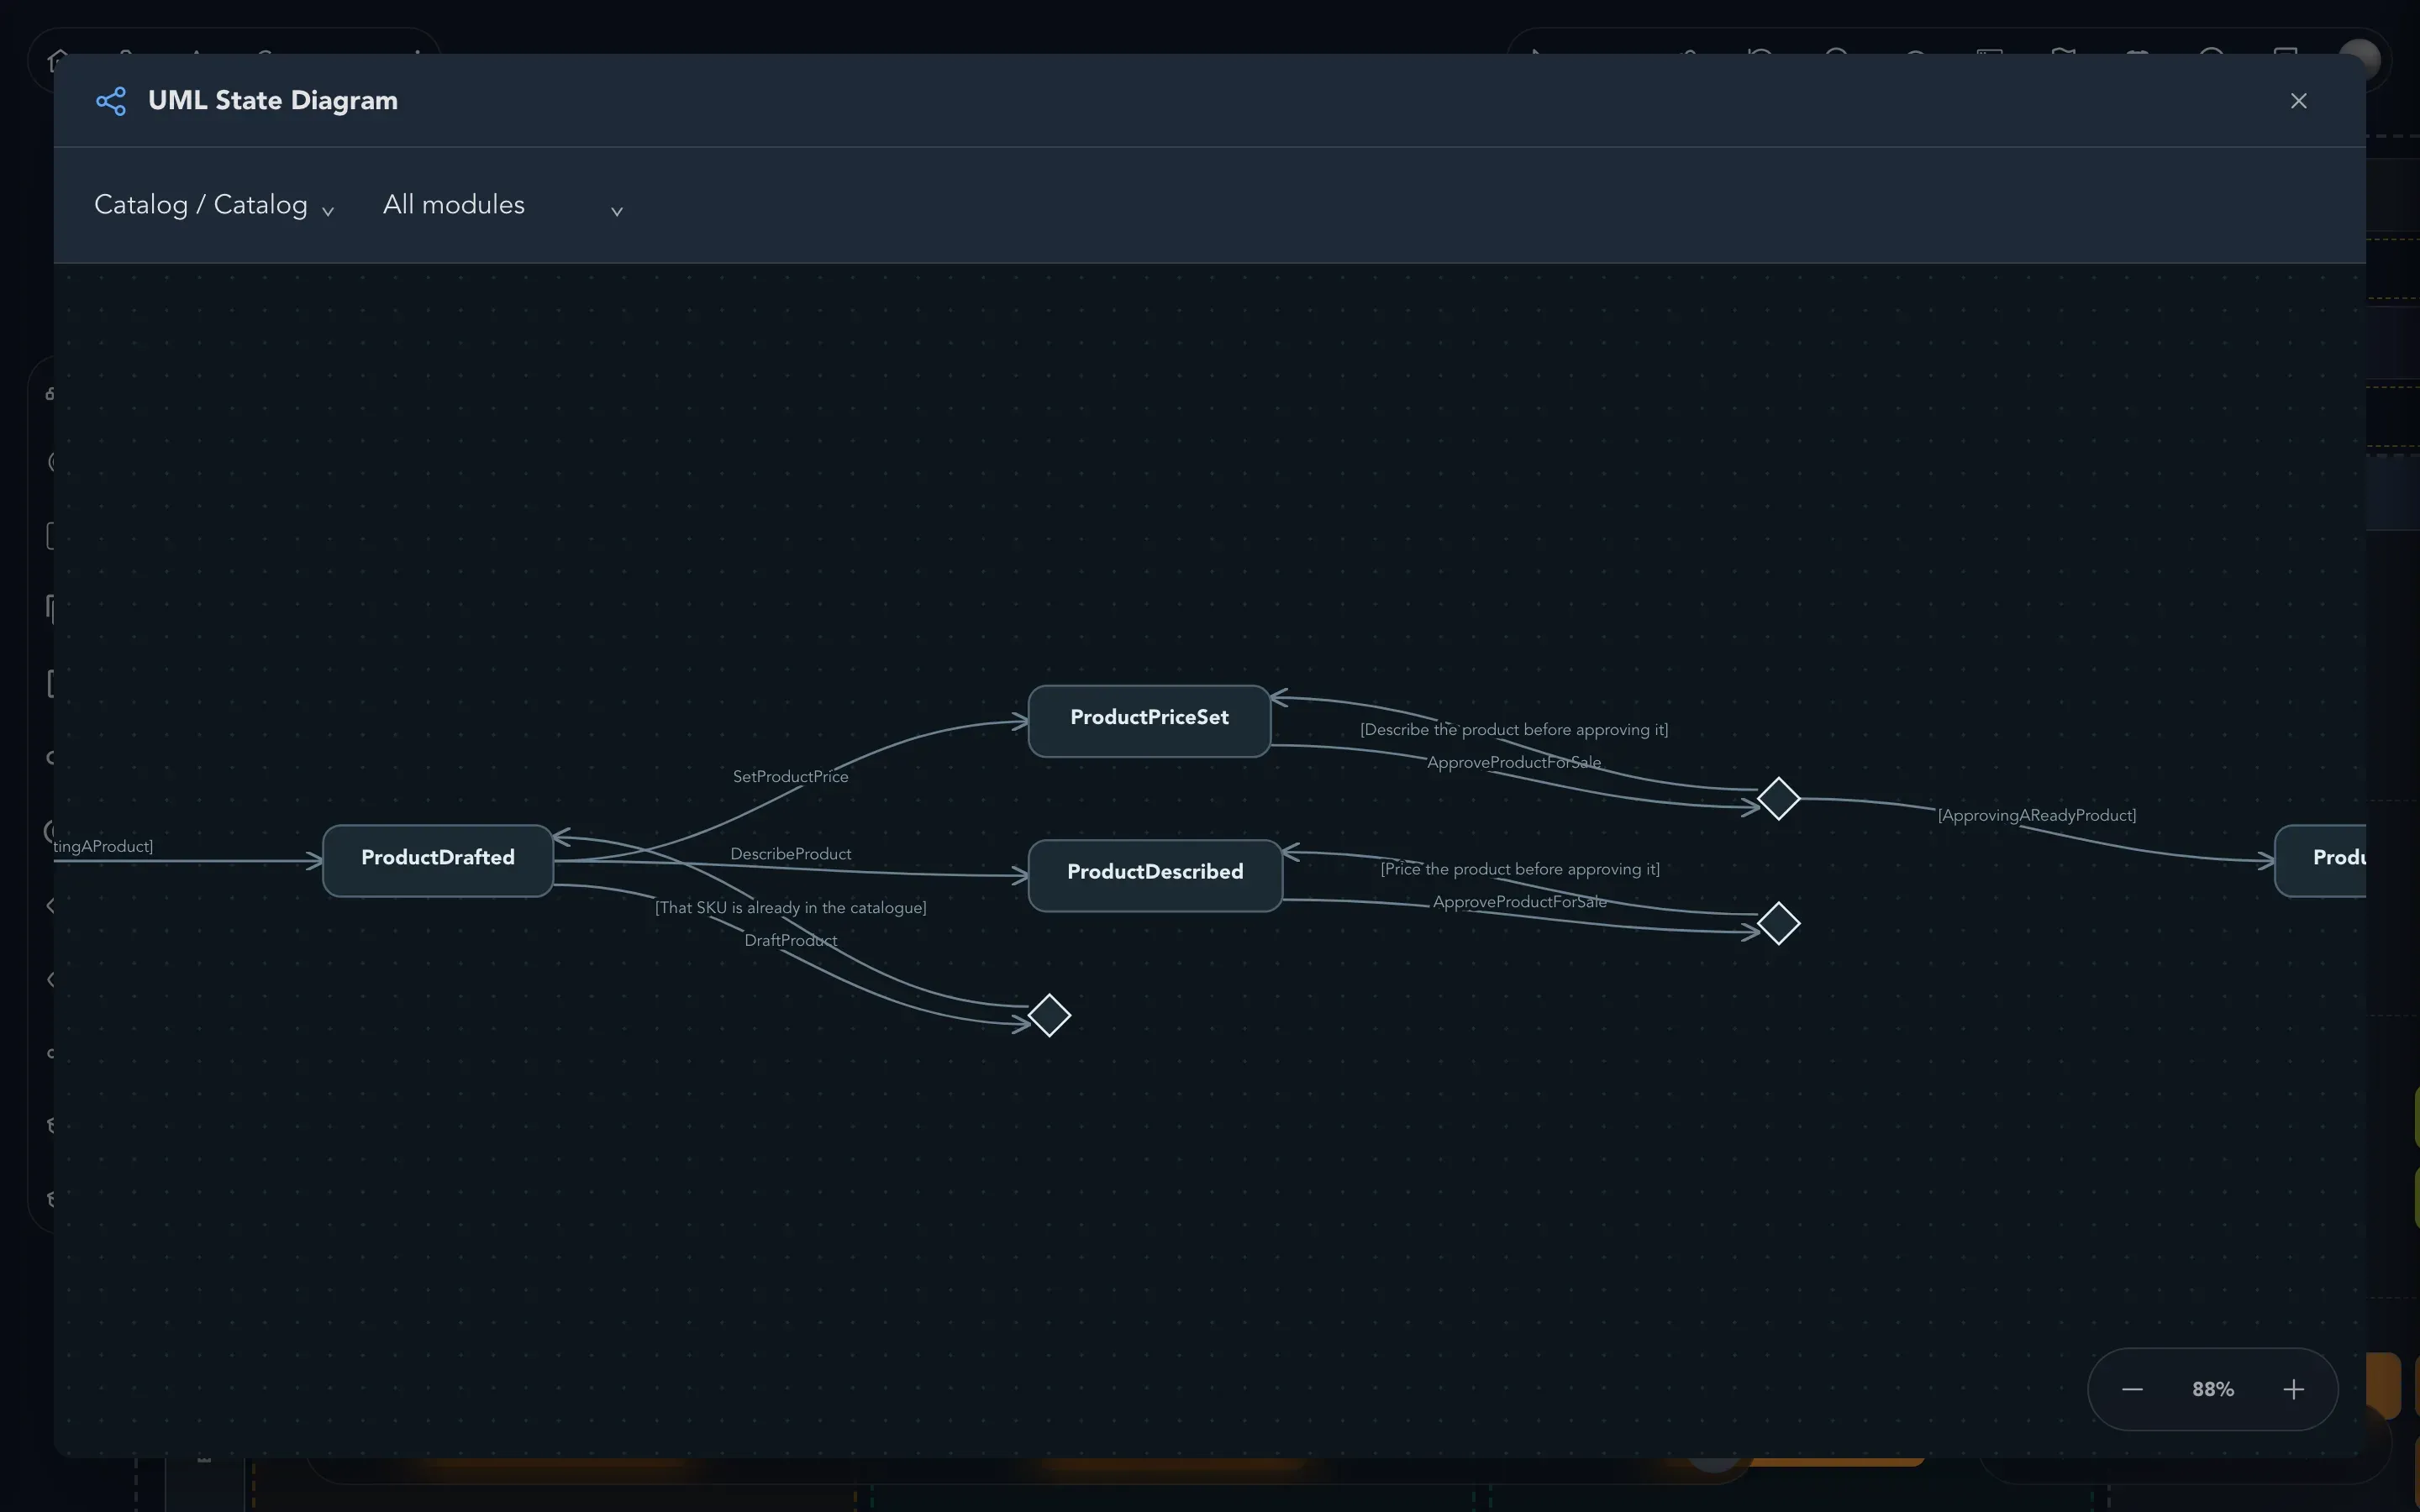
A diagram can say it has nothing to draw: for example, a feature in which nothing sends a message produces no sequence diagram. That is the model telling you it has not been drawn that far yet. The diagrams are read-only, so to change what they show, change the model on the event model board.